
Make customer retention and loyalty a pillar for growth
Winning new clients matters, but lowering churn and raising renewal rates often matters more. In B2B, long sales cycles make every acquisition expensive, so each client you keep adds to customer lifetime value (CLV) and safeguards revenues.

of growth is achieved by top B2B performers without adding any new customers.
McKinsey & Company reportmedian payback period for a B2B SaaS company to earn the cost of acquiring one customer.
Aleph, SaaS & AI Benchmark Reportof B2B existing clients will likely switch suppliers due to poor-quality digital customer experiences.
McKinsey & Company reportfaster growth for companies that keep and grow their existing clients while winning new ones efficiently (71% vs. 10%).
High Alpha, SaaS Benchmarks ReportCustomer loyalty definition
Customer retention is your ability to secure continuous client buying, measured by churn rate, renewal rate and CLV. In B2B, it is the fastest route to predictable revenue.
Scroll down to see why.
The ROI of customer retention
Trust is a key driver for B2B client loyalty
Trust drives renewals, and experience builds trust.
Forrester found that B2B buyers are nearly twice as likely to pay a premium to continue working with companies they trust.
Forrester also identified seven dimensions of trust: accountability, competence, consistency, dependability, empathy, integrity, and transparency.
These levers turn trust from an abstract ideal into a measurable strategy. Their research found that buyers prioritize competence, consistency, and dependability above all others.
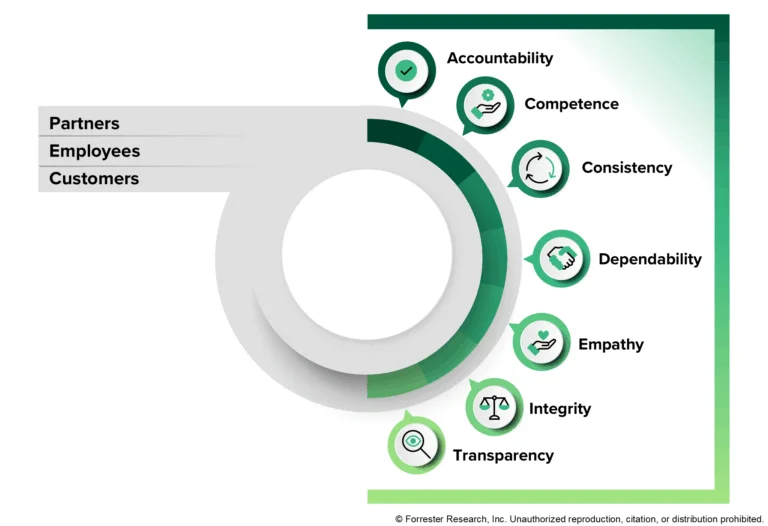 Source: Forrester, Trust: The hard currency of B2B partner ecosystem success
Why it is harder in B2B
Five steps to achieve client loyalty
Continuous THRIVE® is our growth model for balancing client acquisition with retention.
Its retention component is a 5-step framework: Assess Analyze Plan Execute Measure.
Customer satisfaction survey
We measure how clients & ex-clients feel about your organization: satisfaction, perception of your brand, the pain points in their journey and what makes them stay longer. The findings become your baseline for churn and renewal targets.
Related: Sample NPS surveyThe 5-step customer retention checklist
Audit your current program. Tick what you already do; the gaps are where churn usually starts.
Customer satisfaction survey
Client expectation analysis
Client loyalty strategy
Retention execution
Loyalty progress assessment
A sample NPS survey for B2B accounts
Six sample questions that turn a satisfaction score into reasons you can act on. Ask different stakeholders at the account, not only the contract signer.
-
Q1
How likely are you to recommend us to a colleague? 0–10 scale · Core NPS question
-
Q2
What is the main reason for your score? Open answer
-
Q3
Which part of working with us creates the most value for your team? Open answer
-
Q4
Where have you run into issues or delays in the past quarter? Open answer
-
Q5
How well do we understand your business goals? 1–5 scale
-
Q6
What one change would make you more likely to renew? Open answer
When to send it
- Quarterly for every active/new non-active account
- 30 days after onboarding, to catch early friction
- 60–90 days before renewal, while there is time to act
- Keep it under five minutes and follow up with every critique
NPS benchmarks by industry
NPS runs from −100 to +100. Aim to beat your industry median and your own last score.
| Segment | Median NPS |
|---|---|
| Consulting | 68 |
| Financial Services | 68 |
| Technology & Services | 63 |
| Construction | 42 |
| Logistics & Transportation | 42 |
| B2B Software & SaaS | 41 |
A high NPS does not guarantee high retention. If the survey isn’t conducted properly, you will get biased findings.
Customer retention KPIs to track
Pick a KPI, then move the sliders to calculate your own.
- Net Promoter Score (NPS)
- How likely clients are to recommend you. Formula: % promoters (9–10) minus % detractors (0–6). Review: quarterly.
- Client churn rate
- The share of clients you lose in a period. Formula: Clients lost ÷ clients at start of period × 100. Review: monthly.
- Contract renewal rate
- How many contracts renew before they are due to expire. Formula: Contracts renewed ÷ contracts up for renewal × 100. Review: monthly.
- Upsell % (expansion revenue rate)
- How much existing accounts grow. Formula: Expansion revenue ÷ initial revenue × 100. Review: quarterly.
- Customer lifetime value (CLV)
- The total value of one client relationship. Formula: Annual revenue × gross margin × years retained. Review: twice a year.
- Repeat purchase rate
- For non-subscription models: how many clients buy again. Formula: Clients with 2+ purchases ÷ total clients × 100. Review: quarterly.
A sample 90-day retention program
Retention starts at kickoff. This execution example shows how our retention programs roll out across the first quarter and how we tap into the loyalty improvements.
-
Days 1–30
Welcome and align
- Kickoff with every internal stakeholder
- Review NPS results and buyer/users/executives’ expectations
- Share success criteria and expectations
- Explain plan of action and communications for each client milestone
- Assign an owner to every retention action
- Set churn and renewal rate targets
-
Days 31–60
Activate
- Train internal stakeholders on the improved workflows
- Run retention campaigns across sales, service and marketing based on various client milestones
- Share client experience feedback milestone report
- Resolve early pain points before they grow
- Measure churn and renewal rate
-
Days 61–90
Prove value
- Send an onboarding NPS pulse
- Measure churn and renewal rate
- Run a business review against success criteria
- Agree about next-quarter goals and retention opportunities